
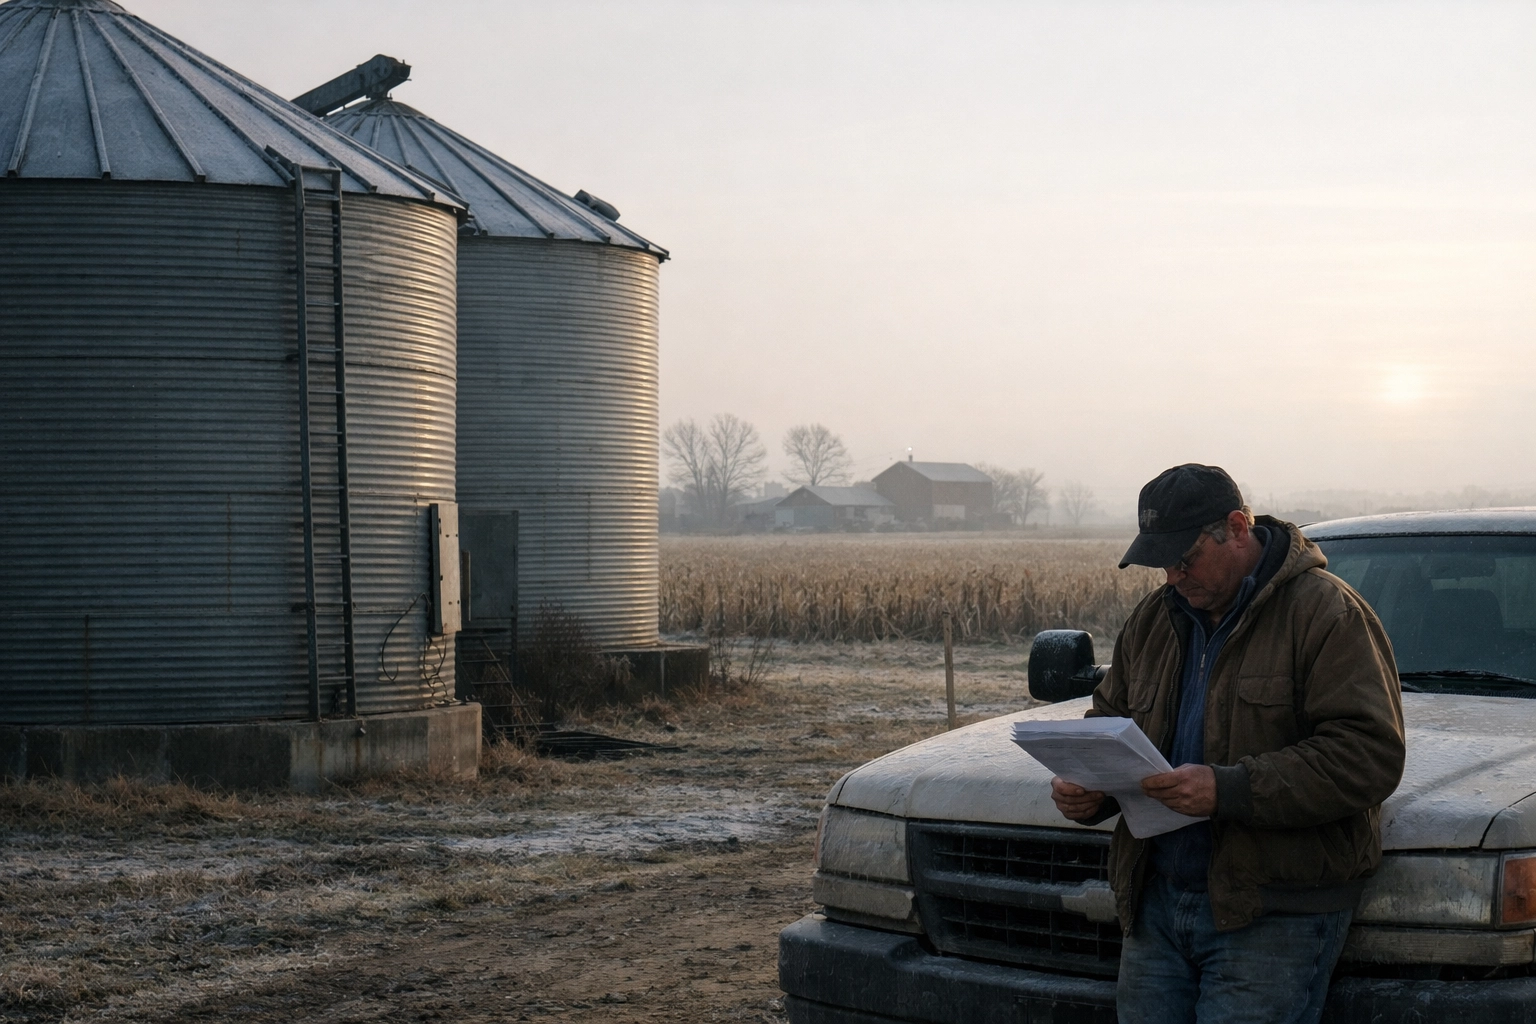
The tension did not begin in a cornfield. It began in bond markets.
In early 2026, Treasury yields remain elevated compared to the pre-pandemic decade. Credit is tighter. Global growth forecasts have been revised downward. Energy markets are volatile but no longer in crisis mode. Inflation, while cooler than its 2022 peak, has proven sticky in core categories. For agriculture, which operates at the intersection of global trade, capital markets, and domestic consumption, that macroeconomic environment matters deeply.
Net farm income is falling again in 2026 not because of a single shock, but because multiple macro forces are converging at once: normalized commodity prices, structurally higher input costs, rising real interest burdens, and a cooling global demand picture. According to the U.S. Department of Agriculture’s Economic Research Service, net farm income surged in 2022 and then retreated sharply in subsequent years as prices softened and government payments declined . The 2026 decline reflects a continuation of that recalibration.
But aggregated national data conceal something more fragile: margin compression at the farm gate.
This is not the 1980s farm crisis. Balance sheets are stronger. Equity remains significant. Yet liquidity — the ability to comfortably absorb shocks — is tightening. And that tightening translates into real operational stress across American agriculture.
The Macroeconomic Squeeze on Agriculture
Agriculture is often described as cyclical. That is true, but incomplete. Farming is also profoundly financialized. It depends on short-term operating loans, long-term land financing, input supply chains priced in global markets, and export demand denominated in dollars.
When interest rates rose sharply between 2022 and 2024, agriculture did not feel the full impact immediately. Many producers carried fixed-rate loans secured during the ultra-low-rate period. But by 2026, refinancing cycles and operating credit lines increasingly reflect the higher-rate environment.
The Federal Reserve’s data on agricultural lending show steady increases in farm loan rates and tighter credit standards in several regions (Federal Reserve agricultural finance reports). That tightening doesn’t always show up as denial. It appears as stricter underwriting, reduced flexibility, and more scrutiny of projected cash flow.
At the same time, global demand growth has moderated. China’s economic expansion has slowed relative to prior decades. European growth remains subdued. Emerging markets face currency pressures. When global growth decelerates, commodity-intensive sectors feel it quickly.
For U.S. agriculture, this means fewer upside surprises.
Similar decisions are playing out across US Agribusiness in early 2026. Grain handlers are postponing storage upgrades. Equipment manufacturers are tempering production plans. Food processors are slowing site selection for new facilities.
Supply and Demand: The Normalization Phase
The high-income years of 2021–2023 were shaped by unusual conditions. Pandemic disruptions tightened supply chains. Weather events constrained global output. War in the Black Sea region disrupted grain exports. Prices rose sharply.
Farmers responded rationally: they planted more acres, invested in productivity, and expanded output where possible.
By 2025 and into 2026, global production capacity had largely adjusted. South American soybean acreage expanded significantly. Grain exports from the Black Sea stabilized in partial form. Global fertilizer markets recalibrated.
The result is a classic supply normalization.
U.S. corn and soybean production remains strong. Yields, while variable by region, have not collapsed. Domestic consumption for feed and biofuels remains steady but not dramatically expanding. Export demand faces stiffer competition.
This shift pushes prices toward longer-term averages. The Chicago futures board no longer reflects crisis premiums.
The problem is that farm cost structures were redefined during the high-price era.
Structural Cost Inflation: The New Baseline
Fertilizer prices surged dramatically in 2022. They have since retreated but remain above pre-pandemic norms. Machinery prices climbed and rarely decline. Labor costs have risen in both specialty crop and livestock operations. Crop insurance premiums reflect higher underlying price levels and climate risk modeling.
In many cases, farmers locked in higher land rents during profitable years. Those rental agreements don’t immediately adjust downward when crop prices fall.
The Congressional Budget Office has repeatedly emphasized how input cost inflation interacts with commodity price swings in shaping federal farm program outlays. But at the individual farm level, it feels simpler: costs reset upward faster than they reset downward.
Margin compression occurs when revenue normalizes but costs remain elevated.
A corn grower who earned strong returns in 2022 may face 2026 crop prices that are 20–30% lower, while seed, machinery payments, and cash rent have declined only marginally — if at all.
That is the heart of the income decline.
Across U.S. agriculture in 2026, generational transition has moved beyond a demographic talking point. It has become a structural risk factor—one that influences credit decisions, land markets, capital investment, and long-term production capacity.
The Government Payment Cliff
Government transfers were unusually high during the pandemic years. Emergency programs, trade mitigation payments, and disaster assistance cushioned farm income.
Those extraordinary supports have largely expired.
According to USDA farm income data, direct government payments have fallen significantly from their 2020–2021 peaks. The safety net remains in place — crop insurance, Price Loss Coverage, and Agricultural Risk Coverage programs — but without emergency overlays, total government support is smaller.
This matters because net farm income includes government payments.
When those payments recede, market revenue must compensate. In 2026, it is not.
A Structural Imbalance in Plain View
Midway through 2026, the imbalance can be illustrated simply:

| Component | High-Income Period (2022–23) | 2026 Reality |
|---|---|---|
| Commodity Prices | Crisis-inflated premiums | Normalized, globally competitive |
| Input Costs | Rising but offset by prices | Still elevated, limited relief |
| Government Payments | Pandemic-level support | Reduced to baseline programs |
| Interest Expense | Lower on legacy loans | Higher on refinanced & new debt |
The table highlights why income declines even when farms remain productive. During the high-income phase, three forces — elevated prices, extraordinary payments, and relatively lower debt servicing costs — supported margins. In 2026, all three pillars have weakened simultaneously.
The imbalance is not dramatic in isolation. But combined, it erodes profitability.
For many producers, the equation now hinges on efficiency rather than expansion.
Debt and Capital Pressure
Farm sector debt has been rising gradually, though not explosively. According to USDA data, total farm debt continues to trend upward, reflecting land purchases, machinery financing, and operating credit.
Debt itself is not inherently destabilizing. The U.S. farm sector maintains substantial asset values, particularly in land. Equity ratios remain healthier than in past crises.
But income is what services debt.
When net farm income falls, debt service coverage ratios narrow. A producer who comfortably met payments in 2023 may find those payments consume a larger share of 2026 revenue.
The Federal Reserve Bank of Kansas City and other regional banks have noted increases in farm loan renewals and modest upticks in loan restructuring discussions. This is not panic territory — yet — but it signals pressure building at the margins.
Capital expenditure decisions reflect that caution. Equipment purchases are being delayed. Repair and maintenance budgets expand. Farmers are extending machinery lifecycles rather than upgrading.
That behavior ripples outward. Rural equipment dealerships experience slower turnover. Manufacturing orders soften. Local banks see less aggressive borrowing.
Declining net farm income becomes a regional economic story.
Land Values: Sticky but Vulnerable
Farmland values have proven resilient. Limited supply, investor interest, and historically strong recent incomes have kept auctions competitive in many regions.
But farmland markets often adjust slowly.
If lower income persists, downward pressure could build gradually. Investors sensitive to yield spreads may reconsider allocations if alternative returns remain attractive in financial markets.
For farmers, land is both asset and identity. But it is also collateral. If land values plateau or soften while debt servicing becomes more burdensome, financing flexibility narrows.
The effect is subtle but real: expansion plans stall.
The pressure reshaping U.S. farm economics is not dramatic or headline-driven. It is cumulative. Costs that once rose and fell cyclically have reset structurally higher, and that shift is quietly altering how farms invest, expand, and manage risk.
Sector Variations: Not All Pain Is Equal
Livestock producers present a mixed picture.
Cattle prices have strengthened due to previous herd liquidation, offering some revenue improvement. Yet rebuilding herds requires capital, feed availability, and time. Input costs still matter.
Hog and poultry sectors face export sensitivity. A stronger U.S. dollar reduces export competitiveness. Feed prices, though lower than their peak, remain significant.
Specialty crop growers confront labor cost pressures and regulatory compliance expenses. In California, water management constraints add another layer of uncertainty.
The common thread is margin fragility.
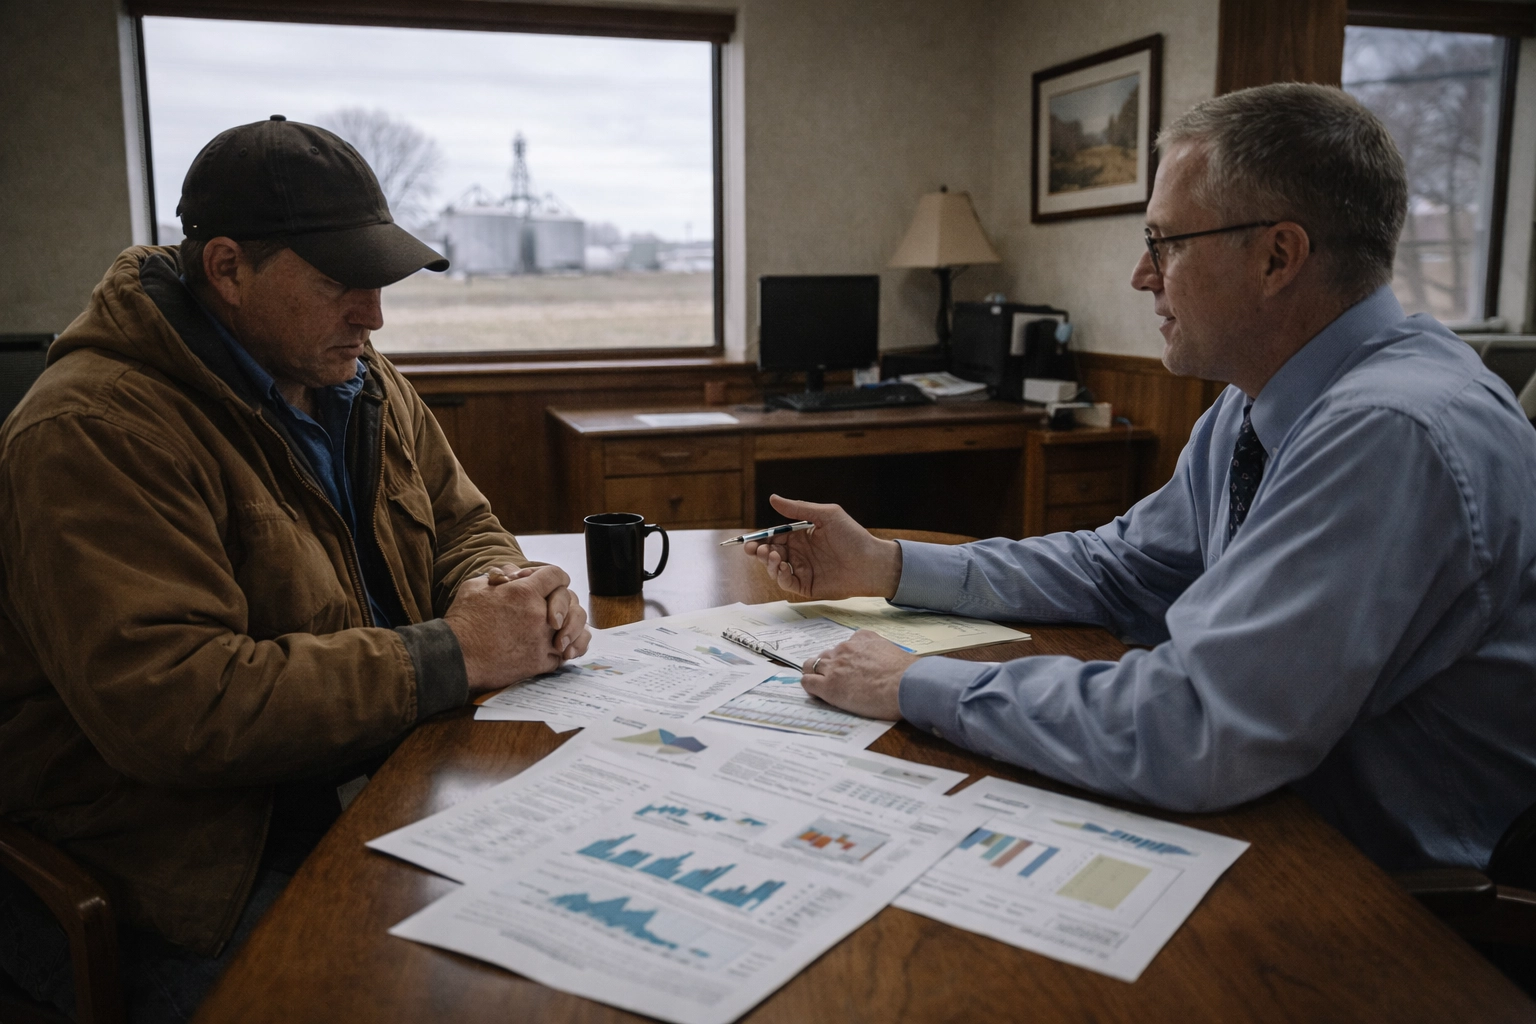
Operational Stress: Translating Numbers into Decisions
At the farm level, declining net income shows up in specific ways:
- Reduced prepayment of inputs.
- Greater scrutiny of seed trait premiums.
- Negotiation of cash rent agreements.
- Delayed capital improvements.
- Increased reliance on crop insurance guarantees.
These are not dramatic headlines. They are incremental adaptations.
A producer may cut discretionary spending. A younger farmer may postpone buying adjacent acreage. A family may defer succession plans until balance sheets stabilize.
This is how macroeconomic tension filters into lived experience.
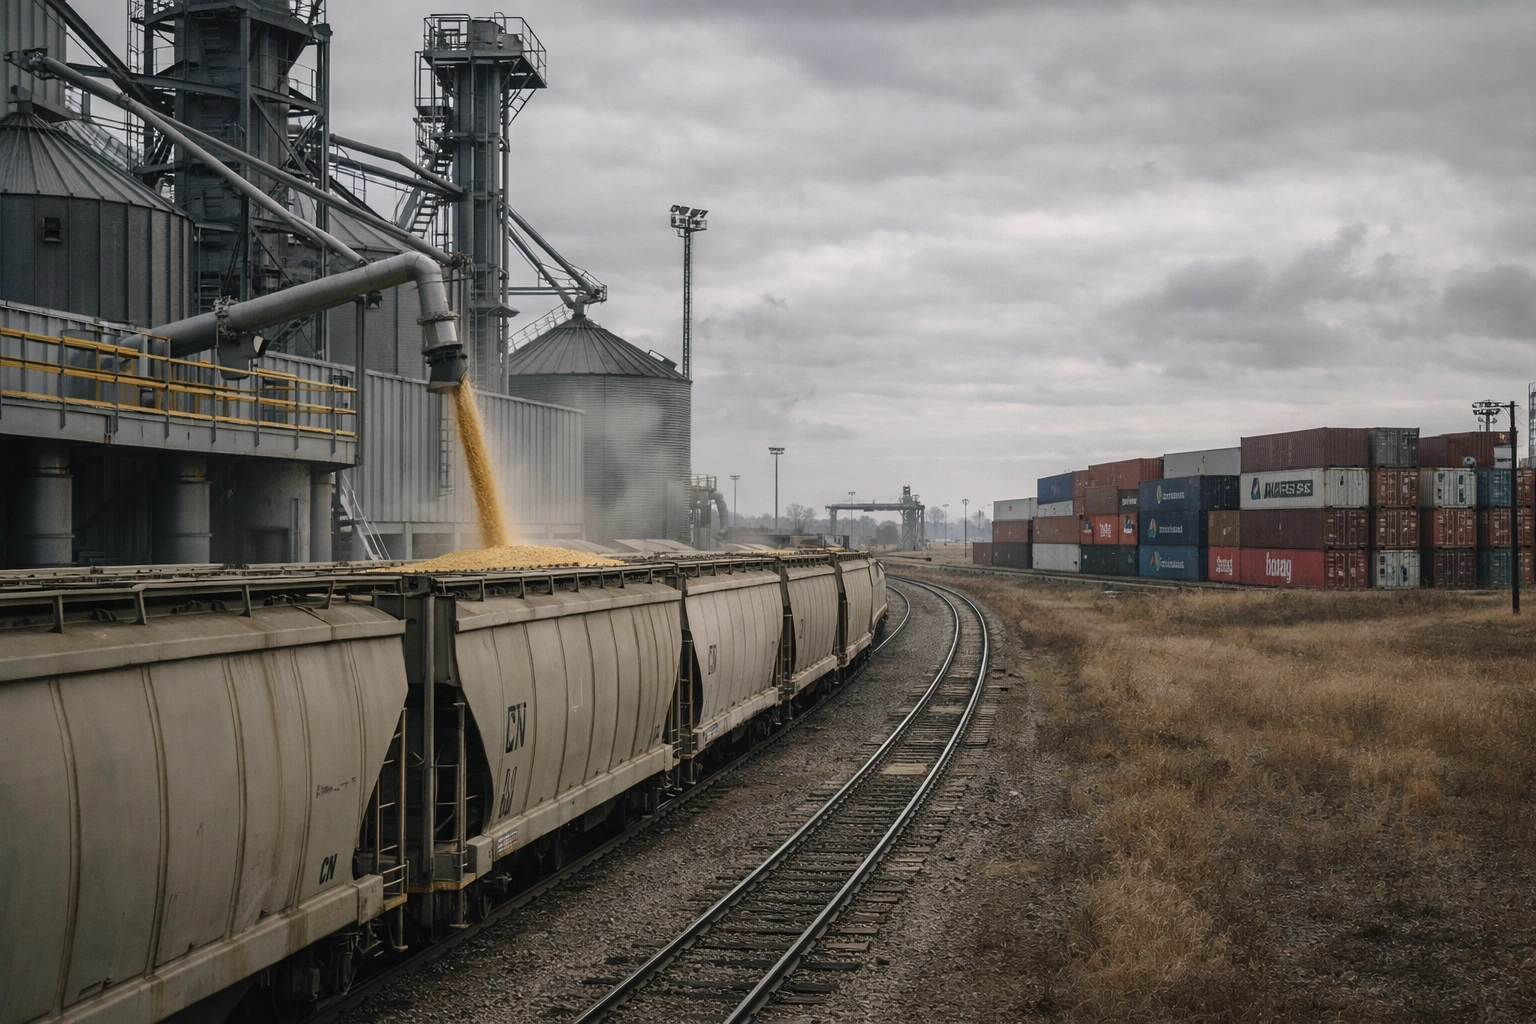
Trade, Currency, and Competitiveness
The strength of the U.S. dollar plays a quiet but influential role. A stronger dollar makes American exports relatively more expensive.
Brazil and Argentina have expanded soybean and corn production aggressively. Their cost structures and currency dynamics sometimes give them pricing advantages in global markets.
Export competitiveness influences basis levels and local cash prices. When export demand softens, storage burdens rise.
The farm economy remains deeply tied to global trade flows.
Risk Management in a Narrower Margin Era
The evolution of crop insurance and risk management tools has strengthened resilience compared to previous decades. Revenue protection policies cushion severe losses.
But insurance does not create profit. It stabilizes downside risk.
In a narrow-margin environment, the goal shifts from maximizing upside to preserving viability.
Producers increasingly focus on cost control, precision agriculture efficiencies, and contract marketing strategies.
Technology adoption continues, but selectively.
What is emerging is not a sudden crisis, but a slow exposure of risk. In that context, “farm aid missing” has become less a slogan and more a description of the moment confronting US agriculture in 2026.
Long-Term Structural Shifts
If 2026 marks more than a cyclical downturn — if it reflects a structural realignment — several long-term shifts may follow:
- Slower Consolidation Pace, But Larger Average Operations
Farms with stronger balance sheets may absorb weaker ones, gradually increasing scale. - Capital Discipline as Norm
Expansion decisions become more cautious. Return-on-investment thresholds rise. - Policy Recalibration Pressure
Lower incomes could renew debates over reference prices and safety net modernization. - Greater Financialization
Investors and institutional capital may seek structured farmland investments, altering ownership patterns. - Increased Climate Risk Pricing
Insurance and lending models may further incorporate climate variability into cost structures.
These shifts are not immediate, but they form the backdrop of 2026’s income decline.
The Broader Implications
When net farm income falls, the impact extends beyond producers.
Rural employment slows. Equipment sales moderate. Local banks tighten. Political pressure builds.
Food prices do not automatically rise with falling farm income; often, they move independently. That disconnect can obscure the financial stress beneath the surface.
American agriculture remains globally competitive and technologically advanced. It is not collapsing.
But it is recalibrating.
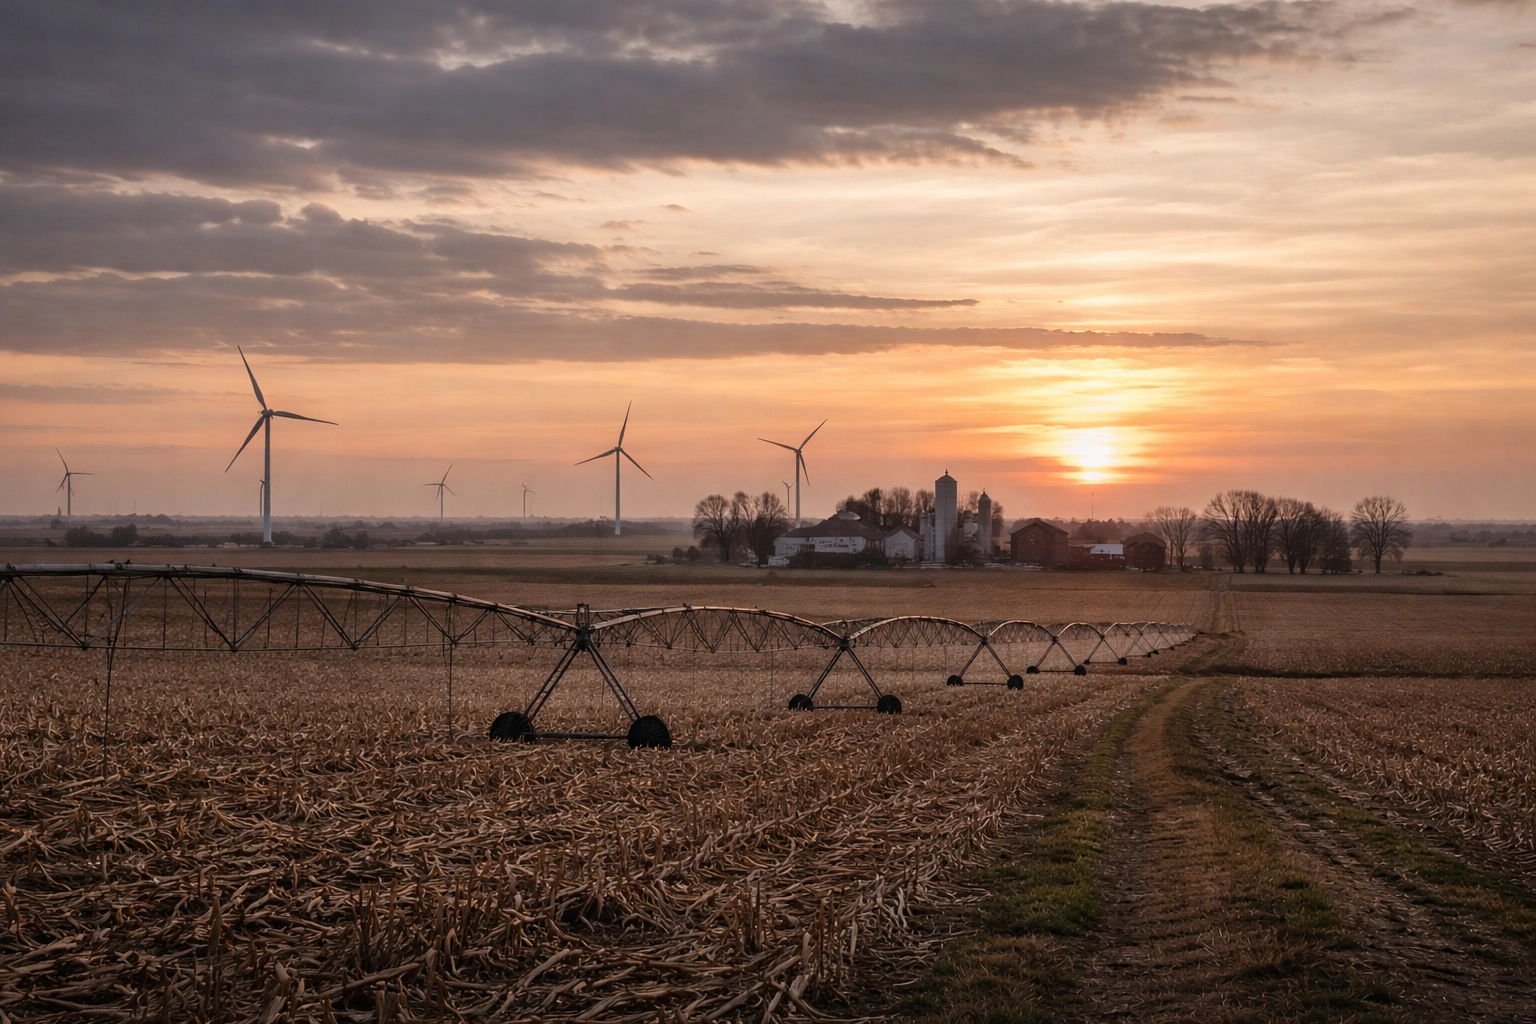
The macroeconomic tension that began in bond markets now echoes in grain bins, cattle lots, and orchard rows. Net farm income is falling again in 2026 because the extraordinary supports of recent years have faded while structural costs remain elevated and capital has grown more expensive.
The farm economy has entered a narrower margin era.
How long it lasts depends on global demand, weather volatility, trade policy, and interest rate trajectories. But for now, the adjustment is real.
And in farm country, adjustment is never abstract. It is measured in acres planted, loans renewed, and decisions deferred — one season at a time.

Written by Janardan Tharkar – an agriculture content researcher and blogging professional with practical experience in farming education, digital publishing, and SEO content optimization. Janardan focuses on modern U.S. agriculture trends, smart farming technologies, irrigation systems, crop development, organic farming practices, and farmer-support programs to create helpful, practical, and trustworthy content for American readers.